The property
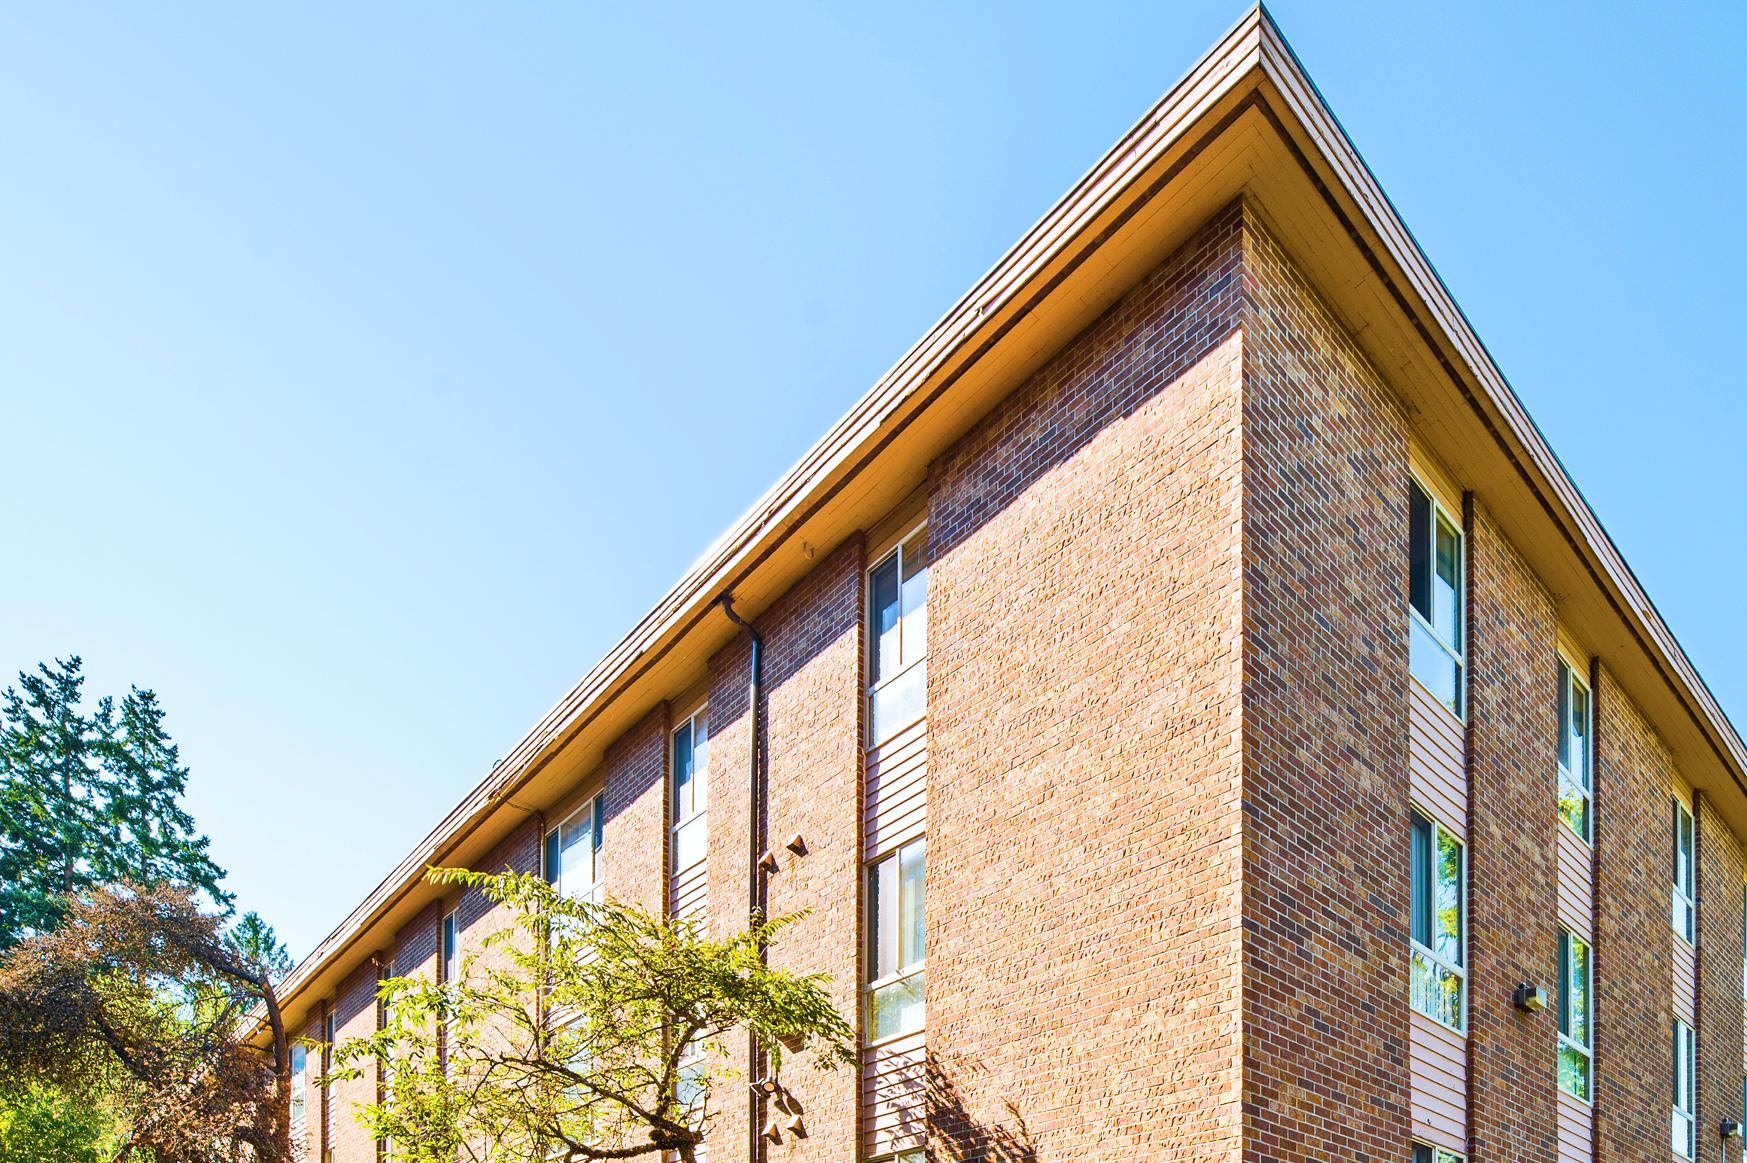
Figures & facts
At a Glance
Thirteen of 21 units occupied, plus one pre-leased. Every remaining vacancy is renovated inventory in lease-up or a Phase 2 unit scheduled for delivery.
Units delivered to date — and every renovated unit brought to market has leased at or above its target rent.
Rent in place today, anchored by long-term residents whose below-market leases the family chose to honor.
The same building fully leased at market — the income lenders and appraisers underwrite against.
The gap — roughly $205,000 a year — closing unit by unit as renovations deliver and lease through November 2026.
Projected 2027 net operating income at stabilization, supporting a ≈1.68× debt-service coverage at refinance.
Current inventory
The Lease-Up Pipeline
| Unit | Type | Size | Status | Market rent |
|---|---|---|---|---|
| 102 | 2/2 · renovated | 985 SF | Pre-leased | $2,295 |
| 104 | 1/1 · renovated | 735 SF | Available | $1,750 |
| 105 | 1/1 · renovated | 735 SF | Available | $1,750 |
| 204 | 1/1 · renovated | 735 SF | Available | $1,750 |
| 107 | 2/1.5 | 965 SF | In renovation · Phase 2 | $1,900 |
| 201 | 1/1 | 735 SF | In renovation · Phase 2 | $1,500 |
| 301 | 1/1 | 735 SF | In renovation · Phase 2 | $1,500 |
| 304 | 1/1 | 735 SF | In renovation · Phase 2 | $1,500 |
| 306 | 2/2 | 985 SF | Notice — 6/30 | $2,150 |
Three renovated units in lease-up, one pre-leased, four in Phase 2 renovation, and 306 returning July 1. Unit-level detail and timing on the Leasing & Market page.
Seven workstreams
Status Across Divisions
Each panel links to its full section.
Lease-Up Status
In progress- Occupied13 units
- Pre-leased1 unit
- Vacant8 units
- Notice (6/30)1 unit
Financials
Tracked- Income today$20,911 / mo
- At stabilization$34,046 / mo
- 2027 NOI (proj.)≈ $248,000
- Construction line≈ $1,500,000
Construction
On track- Water incidentRemediated
- AbatementComplete
- Units delivered7
- RemainingPhases 2–4
Leasing & Market
Proven- Monthly gap$17,124 / mo
- Unit 307 (2/2)Leased $2,350
- Unit 202 (2/2)Leased $2,595
- Unit 102 (2/2)Leased $2,150
Marketing
For approval- Zillow Enhanced$625 / mo · primary
- Google drip + website$200–250 / mo
- EDDM mailer$640 / route
- Apartments.comSituational
Tenant Experience
In place- Move-ins since Sep3 (+1 underway)
- Welcome packetStandard
- Move-in giftsTo select
- ProcessDigital, end-to-end
Owner Platform
Active- AccessChen family logins
- StatementsMonthly, automatic
- DocumentsBids · Reports · Comps
Before & after
Inside a Renovated Unit
Walk a unit in 3D — before and after the renovation — alongside the rooms as they were found.
Before — 3D tour
After — 3D tour
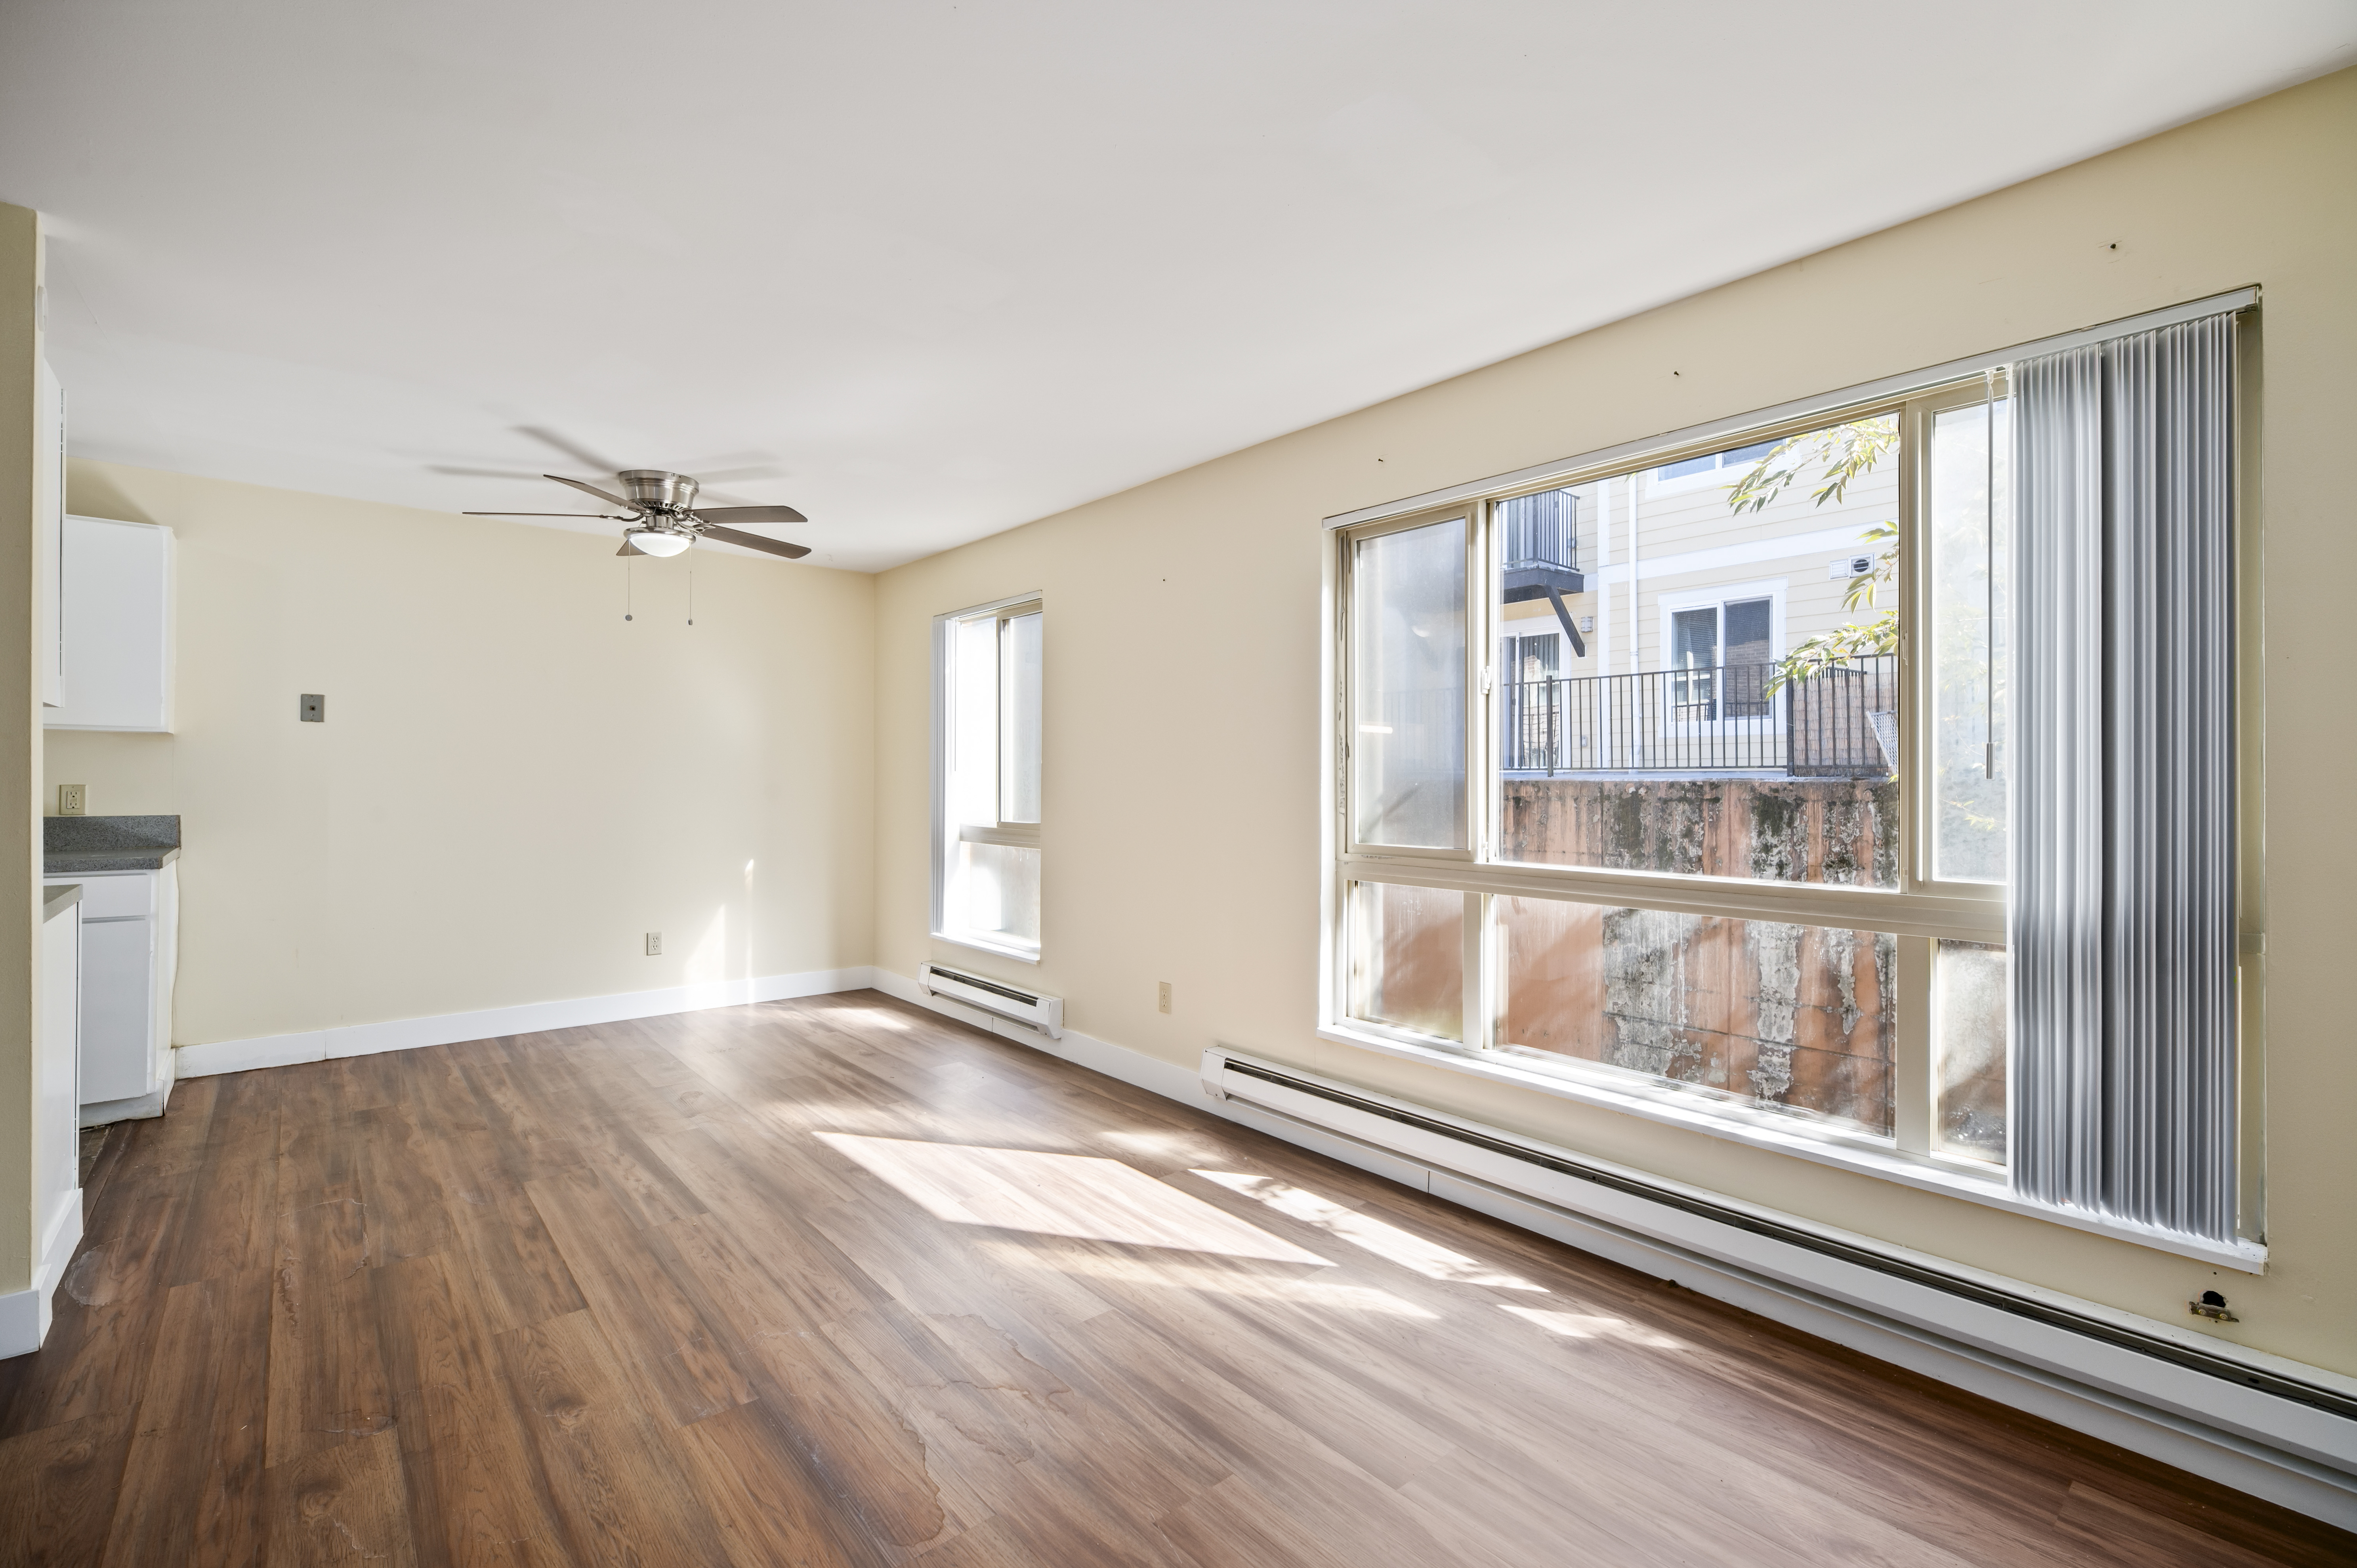
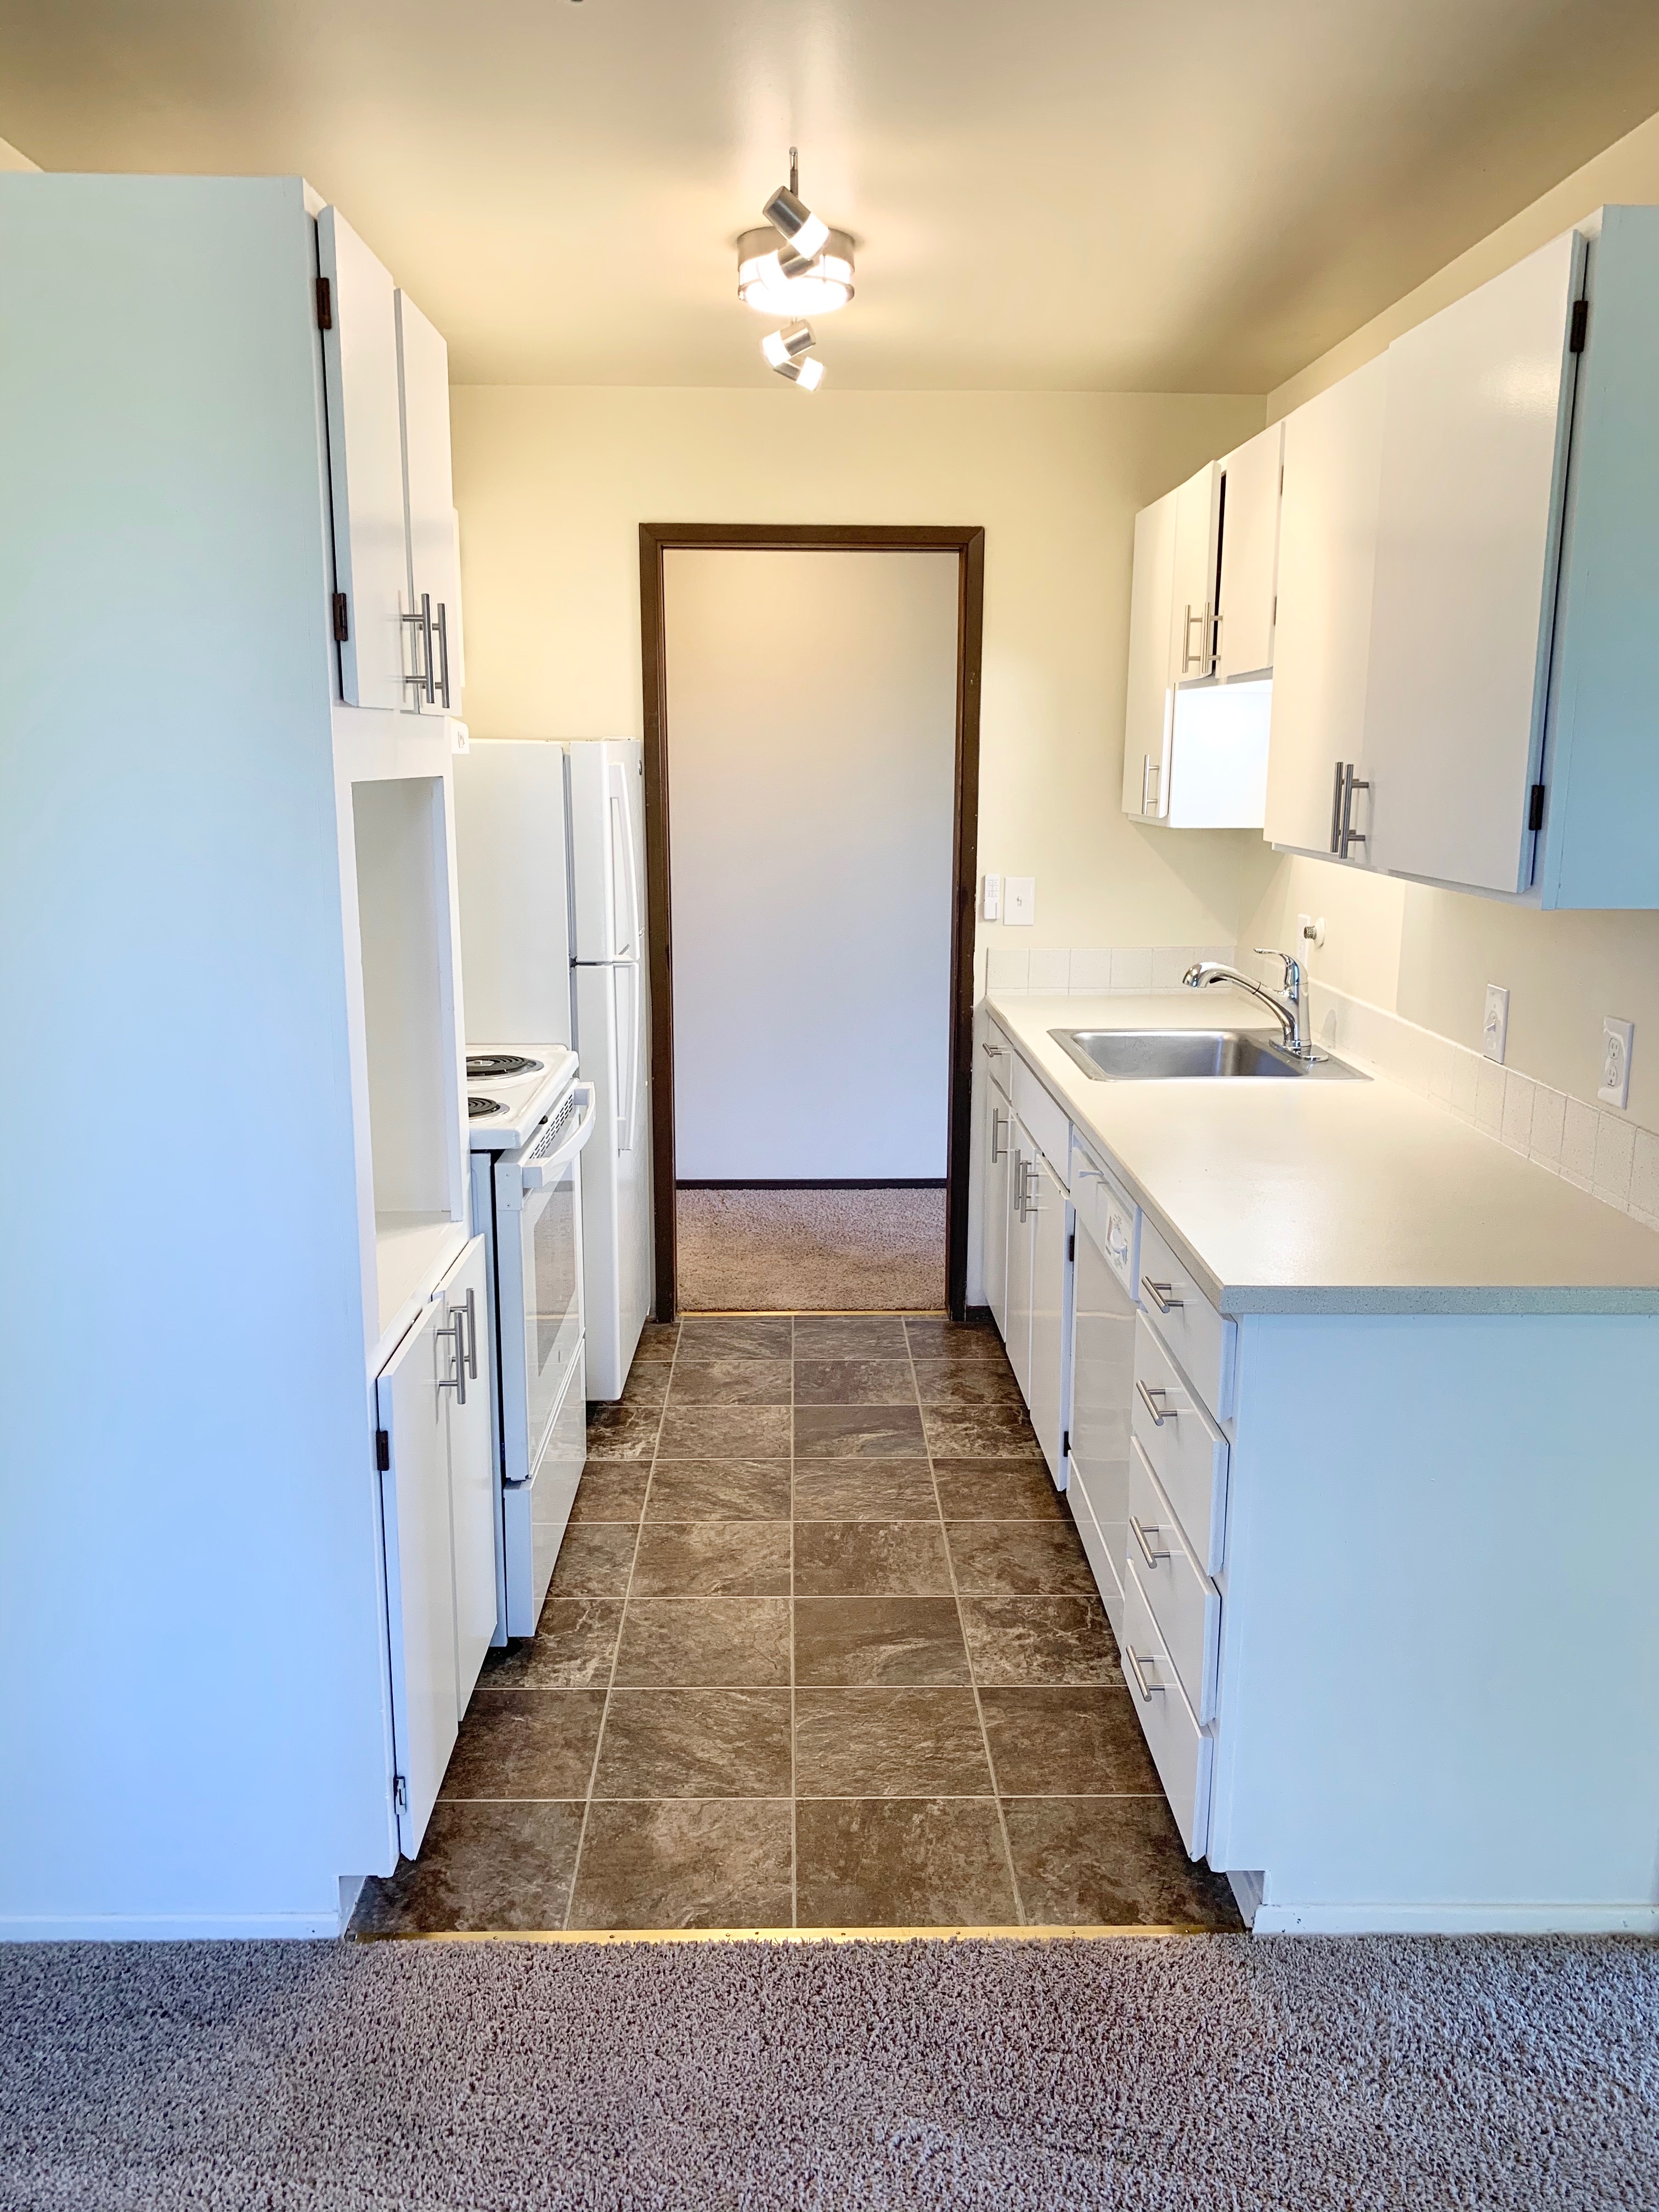
The 3D tours walk a unit before and after; the photos show units as found. Click a photo to enlarge.
Common areas
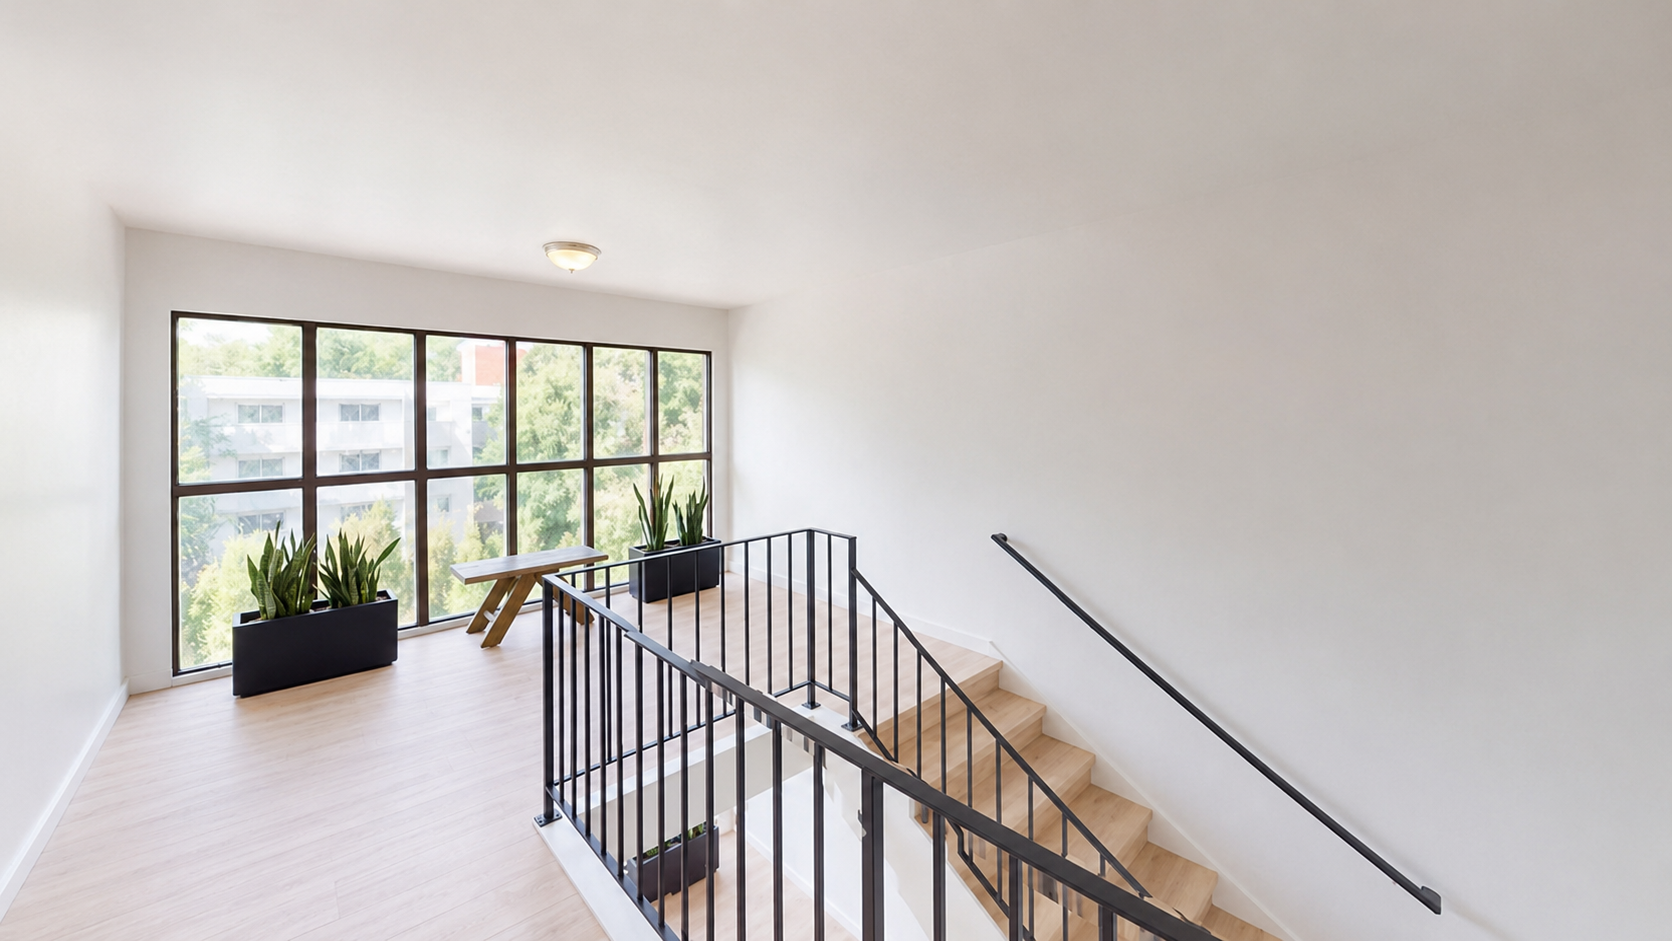
The Stairwell, Before & After
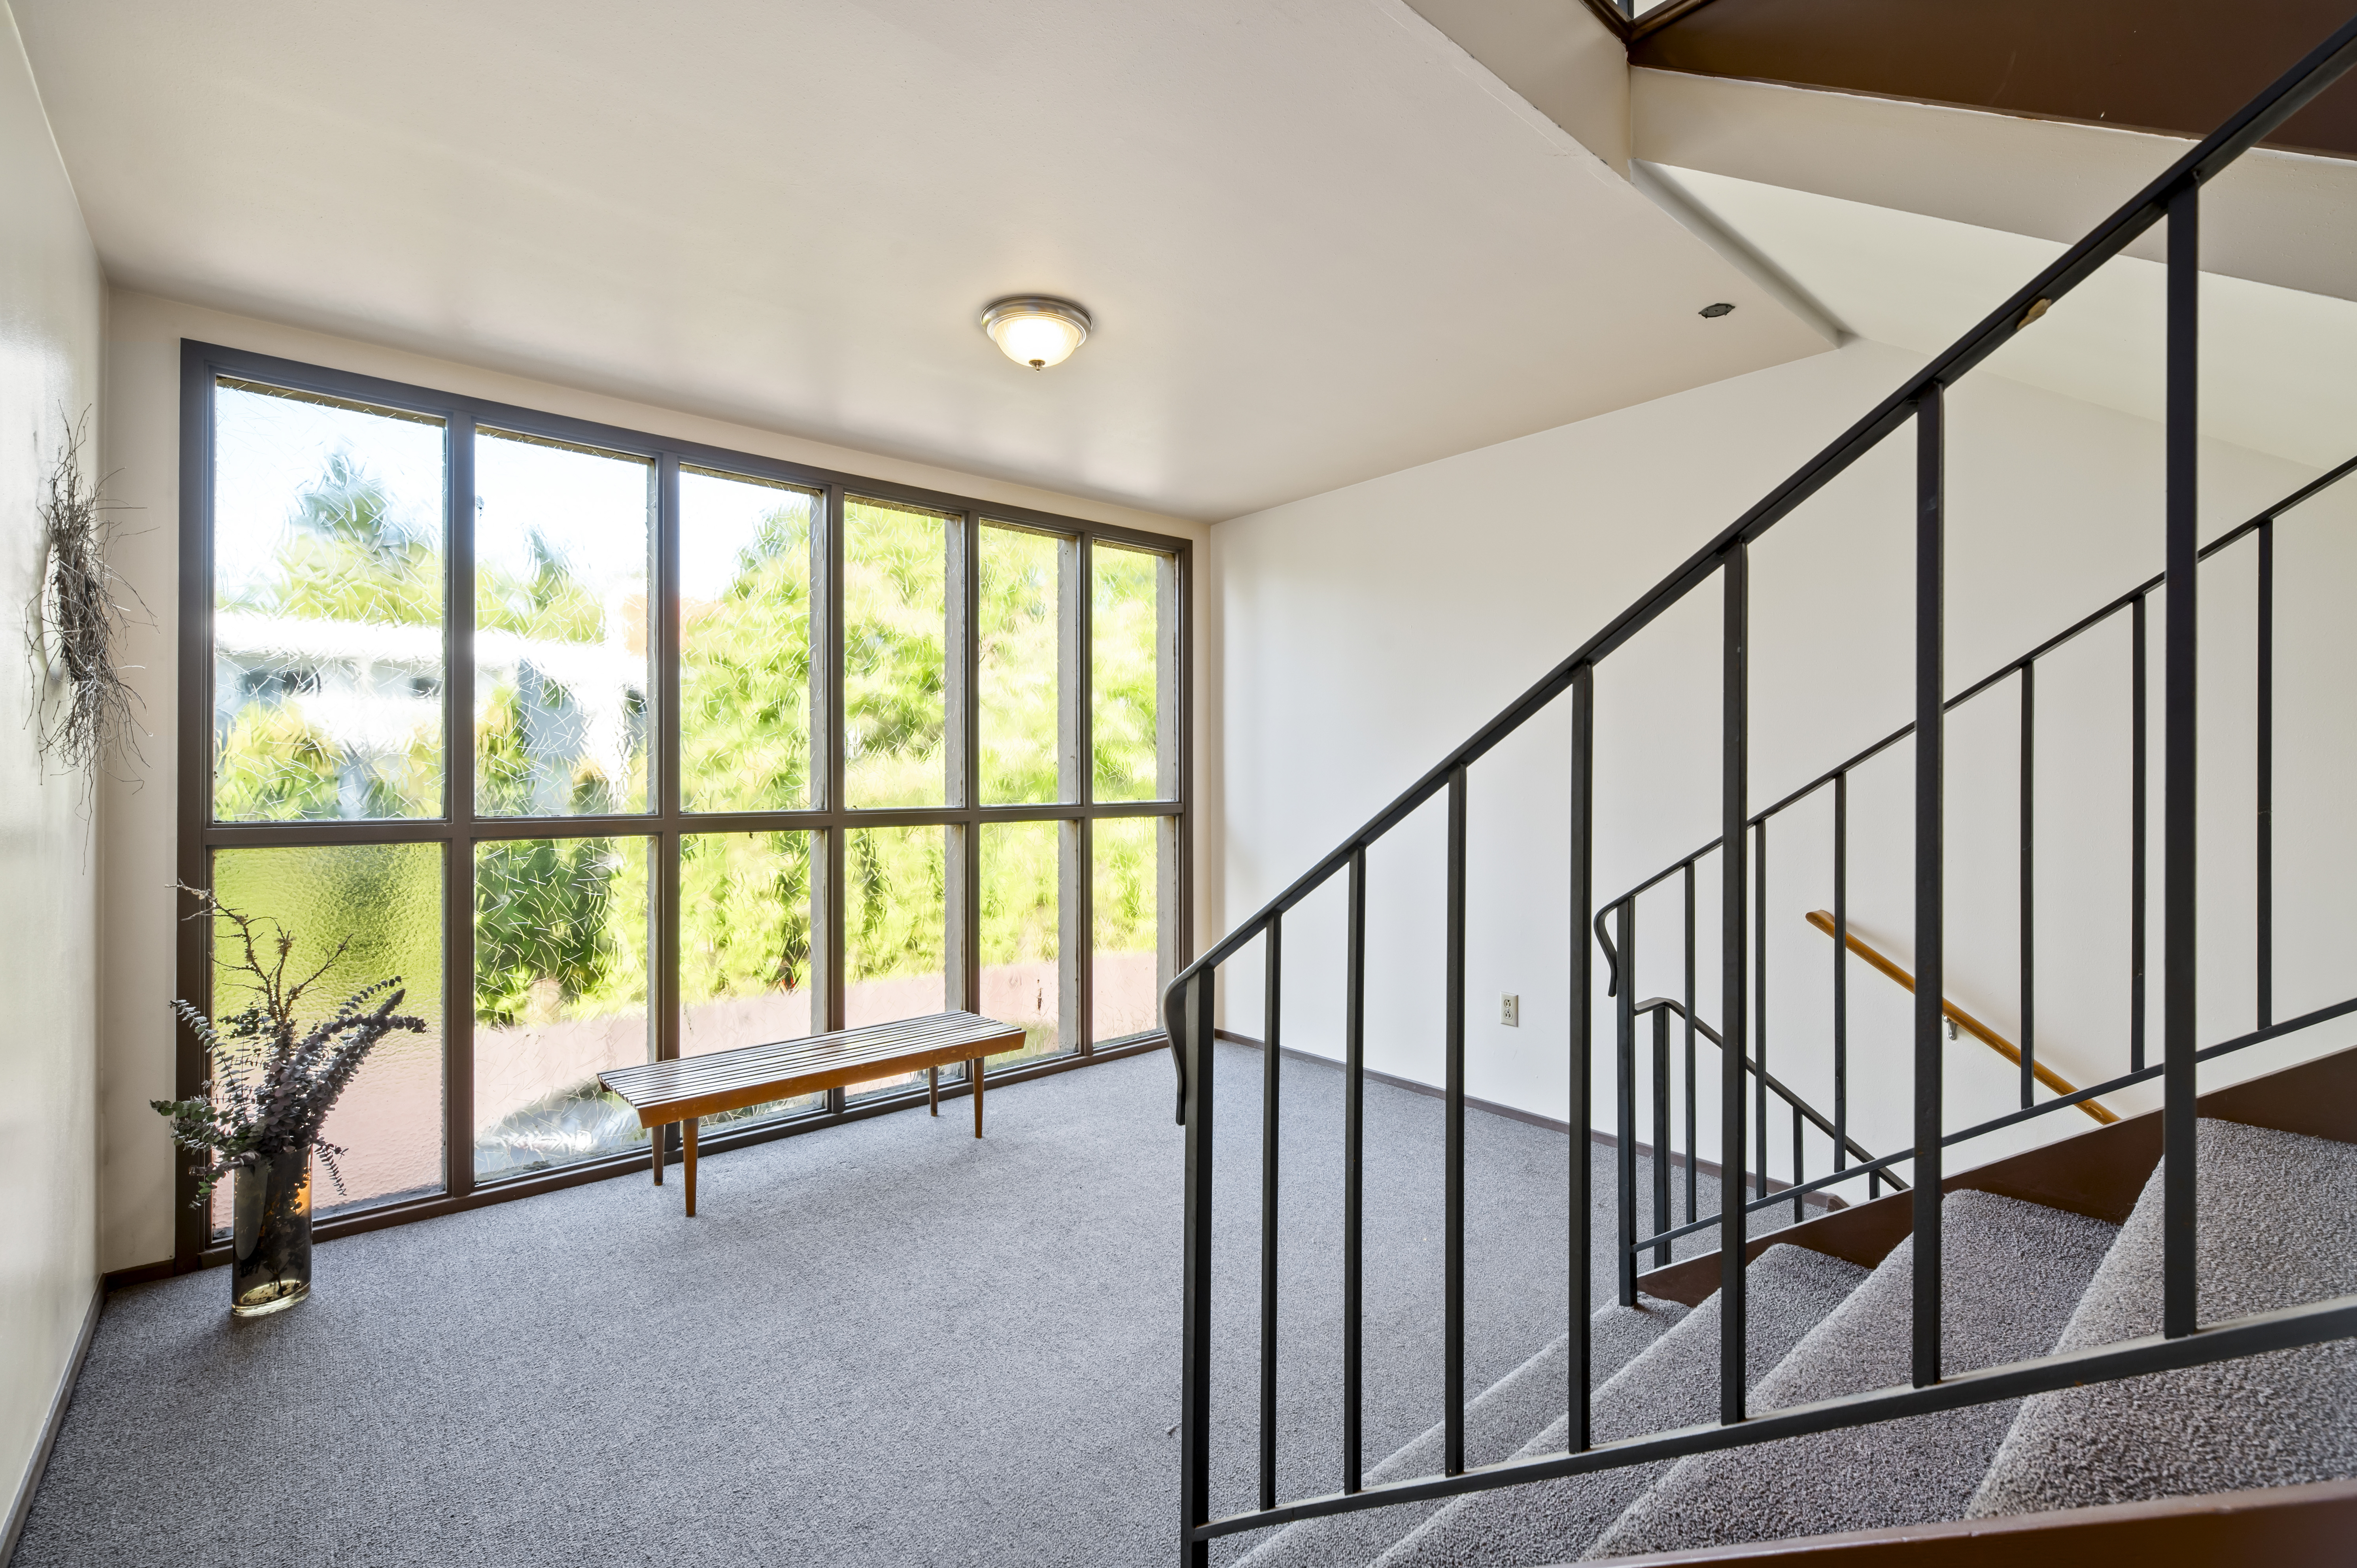
The same shared stairwell — dated carpet and railing brought to the new building standard with wood-look flooring, a clean black rail, and refreshed finishes.
Before
After
Renderings & selections
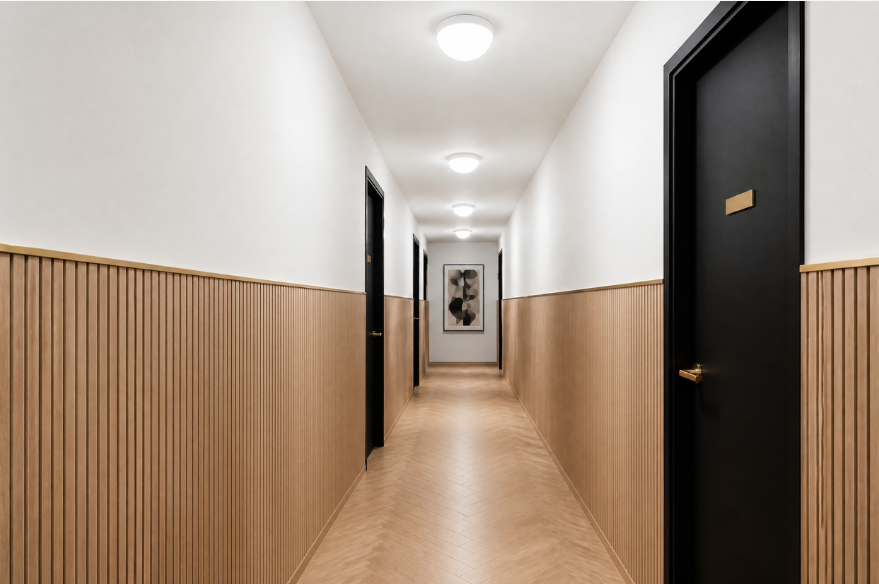
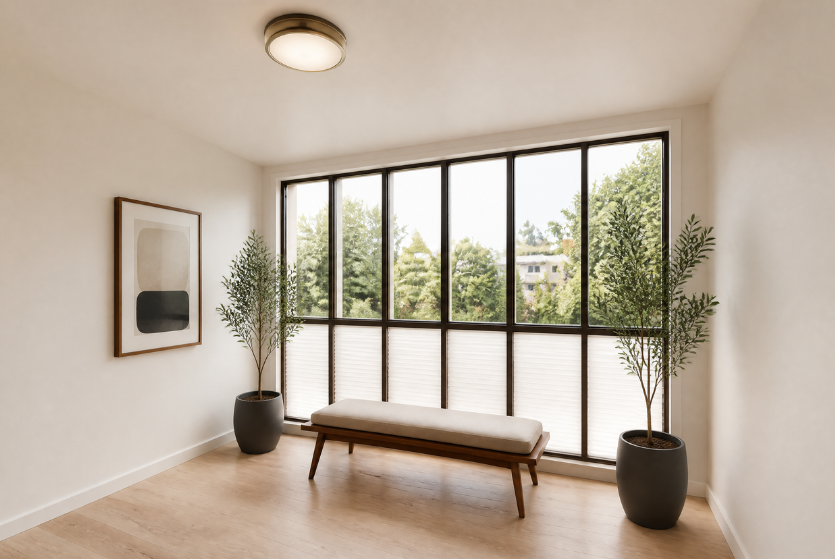
Design Direction
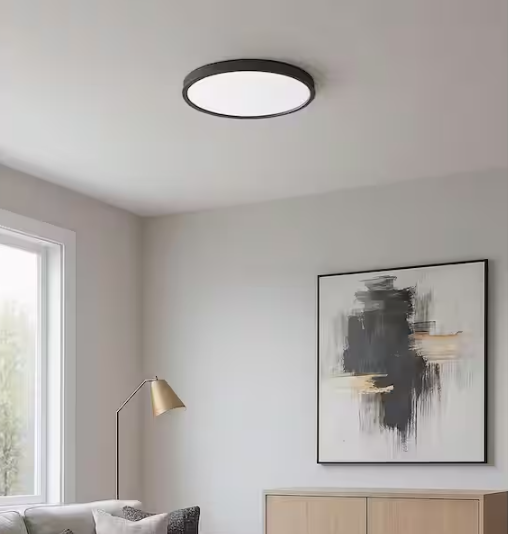
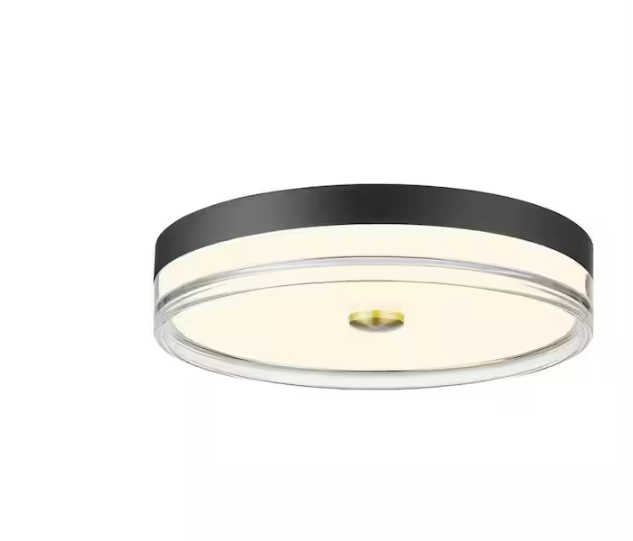
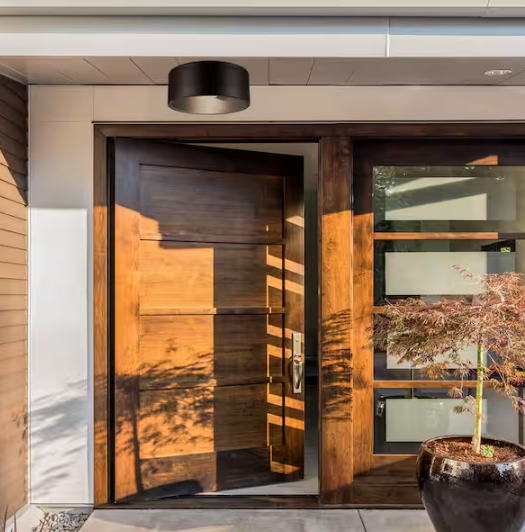
Design that fits White Heather — improving the building without making it generic; natural materials and mid-century lines. Renderings of the renovated common areas below, with lighting still under selection.
Lighting under consideration
The full record
Section Guide
A clear view of what has been done, what comes next, and where your direction keeps things moving — section by section.
Executive Summary
Every division on one screen, with the open decisions.
Financials
Outlook, funding, valuation, and the 2027 refinance.
Construction
Conditions encountered and the four-phase plan.
Marketing
Channel mix, pricing, and current lead activity.
Leasing & Market
The rent gap, the proof, and the comparable set.
Tenant Experience
Resident transfers, the welcome packet, and move-ins.
Owner Platform
Statements, reports, and the property documents.
Pro forma
2026–2027 Outlook
Through 2026
The pro forma stages income month by month as each phase delivers — from $20,911 toward $34,046 per month.
2027, stabilized
The construction line refinances into permanent debt — fixed-rate and amortizing, with capital returned at closing.
Exhibit — Lease-Up Pro Forma
Annual revenue, expenses, and net operating income; projected valuation across capitalization rates; and the estimated construction-line balance at completion. Figures rounded to the nearest dollar.
Operating results by year
| Year | Revenue | Expenses | Net operating income |
|---|---|---|---|
| 2024 | $361,370 | $182,192 | $179,178 |
| 2025 | $304,461 | $219,861 | $107,324 |
| 2026 | $328,651 | $191,712 | $136,939 |
| 2027 | $448,528 | $200,141 | $248,387 |
2027 is the first stabilized year — the source of the ≈$248,000 net operating income quoted through this page.
Projected valuation by capitalization rate
| Year | NOI | 4.00% | 4.50% | 5.00% | 5.50% | 6.00% |
|---|---|---|---|---|---|---|
| 2024 | $179,178 | $4,479,456 | $3,981,738 | $3,583,564 | $3,257,786 | $2,986,304 |
| 2025 | $107,324 | $2,683,101 | $2,384,979 | $2,146,481 | $1,951,346 | $1,788,734 |
| 2026 | $136,939 | $3,423,474 | $3,043,088 | $2,738,779 | $2,489,799 | $2,282,316 |
| 2027 | $248,387 | $6,209,678 | $5,519,714 | $4,967,743 | $4,516,130 | $4,139,786 |
Each column capitalizes the year’s net operating income at that rate (NOI ÷ cap rate). At stabilization, each half-point of cap rate moves the valuation by roughly $400,000–$700,000.
Construction line of credit — estimated balance at completion
| Component | Amount |
|---|---|
| LOC balance as of 5/31/26 | $487,134 |
| Remaining Phase 1 | $79,701 |
| Remaining phases (15 units) | $895,455 |
| Green State (insurance claim) | $153,262 |
| Less: remaining insurance funds | ($211,758) |
| Estimated LOC balance | $1,403,793 |
The balance drawn to date plus the cost to finish Phase 1 and the remaining 15 units, with the Green State insurance-claim work offset by $211,758 in remaining insurance funds. The 2027 financing scenarios plan conservatively around $1,500,000 of total draws by Phase 4 completion.
Sources & uses
Construction & Insurance Funding
An insurance claim covers the February 2026 water event, running alongside the construction line that funds the unit renovations. The figures below are reconciled to the dollar from the claim-tracking sheet.
Insurance claim — February 2026 water event
Restoration of the four water-damaged units (101, 103, 106, 107) and the shared laundry and utility rooms.
| Insurance expense | Amount | Status |
|---|---|---|
| Green State — water remediation | $153,262 | Pending — lien release |
| Put-back reconstruction — 38% deposit (units 101, 103, 106, 107, laundry & utility) | $22,157 | Paid |
| Put-back reconstruction — remaining balance (62% of $58,308) | $36,151 | Pending |
| Change orders 1 & 2 — tub & bathroom finishes | $40,231 | Paid |
| Progress billing — 25% completion | $14,291 | Paid |
| Progress billing — remaining balance (75% of $57,164) | $42,873 | Pending |
| Remaining put-back to bill (Quote 1443) | $20,820 | Scheduled |
| Total insured | $329,785 | — |
| Other expenses — excavation, pipe lining & temporary housing | $53,703 | Paid |
Proceeds of $321,779 cover the bulk of these costs; the remaining $61,709 to finish the put-back work is funded by the project. Policy deductible: $5,000. Full invoices and approved bids are in the owner portal.
Underwriting
Valuation
Lenders and appraisers underwrite the building on what it collects. Closing the rent gap is the valuation strategy.
At stabilization
The 2027 Refinance
At stabilization, the construction line refinances into permanent debt — fixed-rate, amortizing, and returning capital at closing.
Refinance into permanent debt
- $2,000,000 permanent loan — ≈6.25%, 30-year amortization
- ≈$147,800 annual debt service, fixed and amortizing
- Retires the construction line entirely; ≈$500,000 returned at closing
- ≈1.68× debt-service coverage at stabilization
Late 2025 – November 2026
The Four-Phase Plan
The renovation strategy is structured around a four-phase delivery plan, with each phase bringing a defined set of units to the new building standard before releasing them back to market. As completed units return to the leasing pipeline, the next phase begins, creating a steady cadence of renovated inventory without taking the building fully offline. This approach allows the property to maintain leasing activity, preserve operational continuity, and progressively build rental income as each phase is completed.
Phase 1
CompleteUnits 102, 104, 105, 202, 204, 307, plus common areas — and the insurance-loss restoration: units 101, 103, 106, and 107, with the laundry and utility rooms. 307 leased at $2,350; 102 leased June 2026.
Phase 2
In progressUnits 107, 201, 301, 304; unit 306 under change order. 304's resident moved to renovated 307.
Phases 3 & 4
ScheduledRemaining units, renovated as they turn — coordinated with residents requesting transfers.
Closeout
ScheduledCommon areas, exterior, design selections, punch list, and warranty documentation.
Findings to date
Conditions Encountered
A building of this era carries its history in the walls — none of what follows is unusual, and each item was addressed deliberately and documented. Status as of June 2026; photographs in the visual record on the Executive Summary, supporting documents in the owner portal.
Water incident
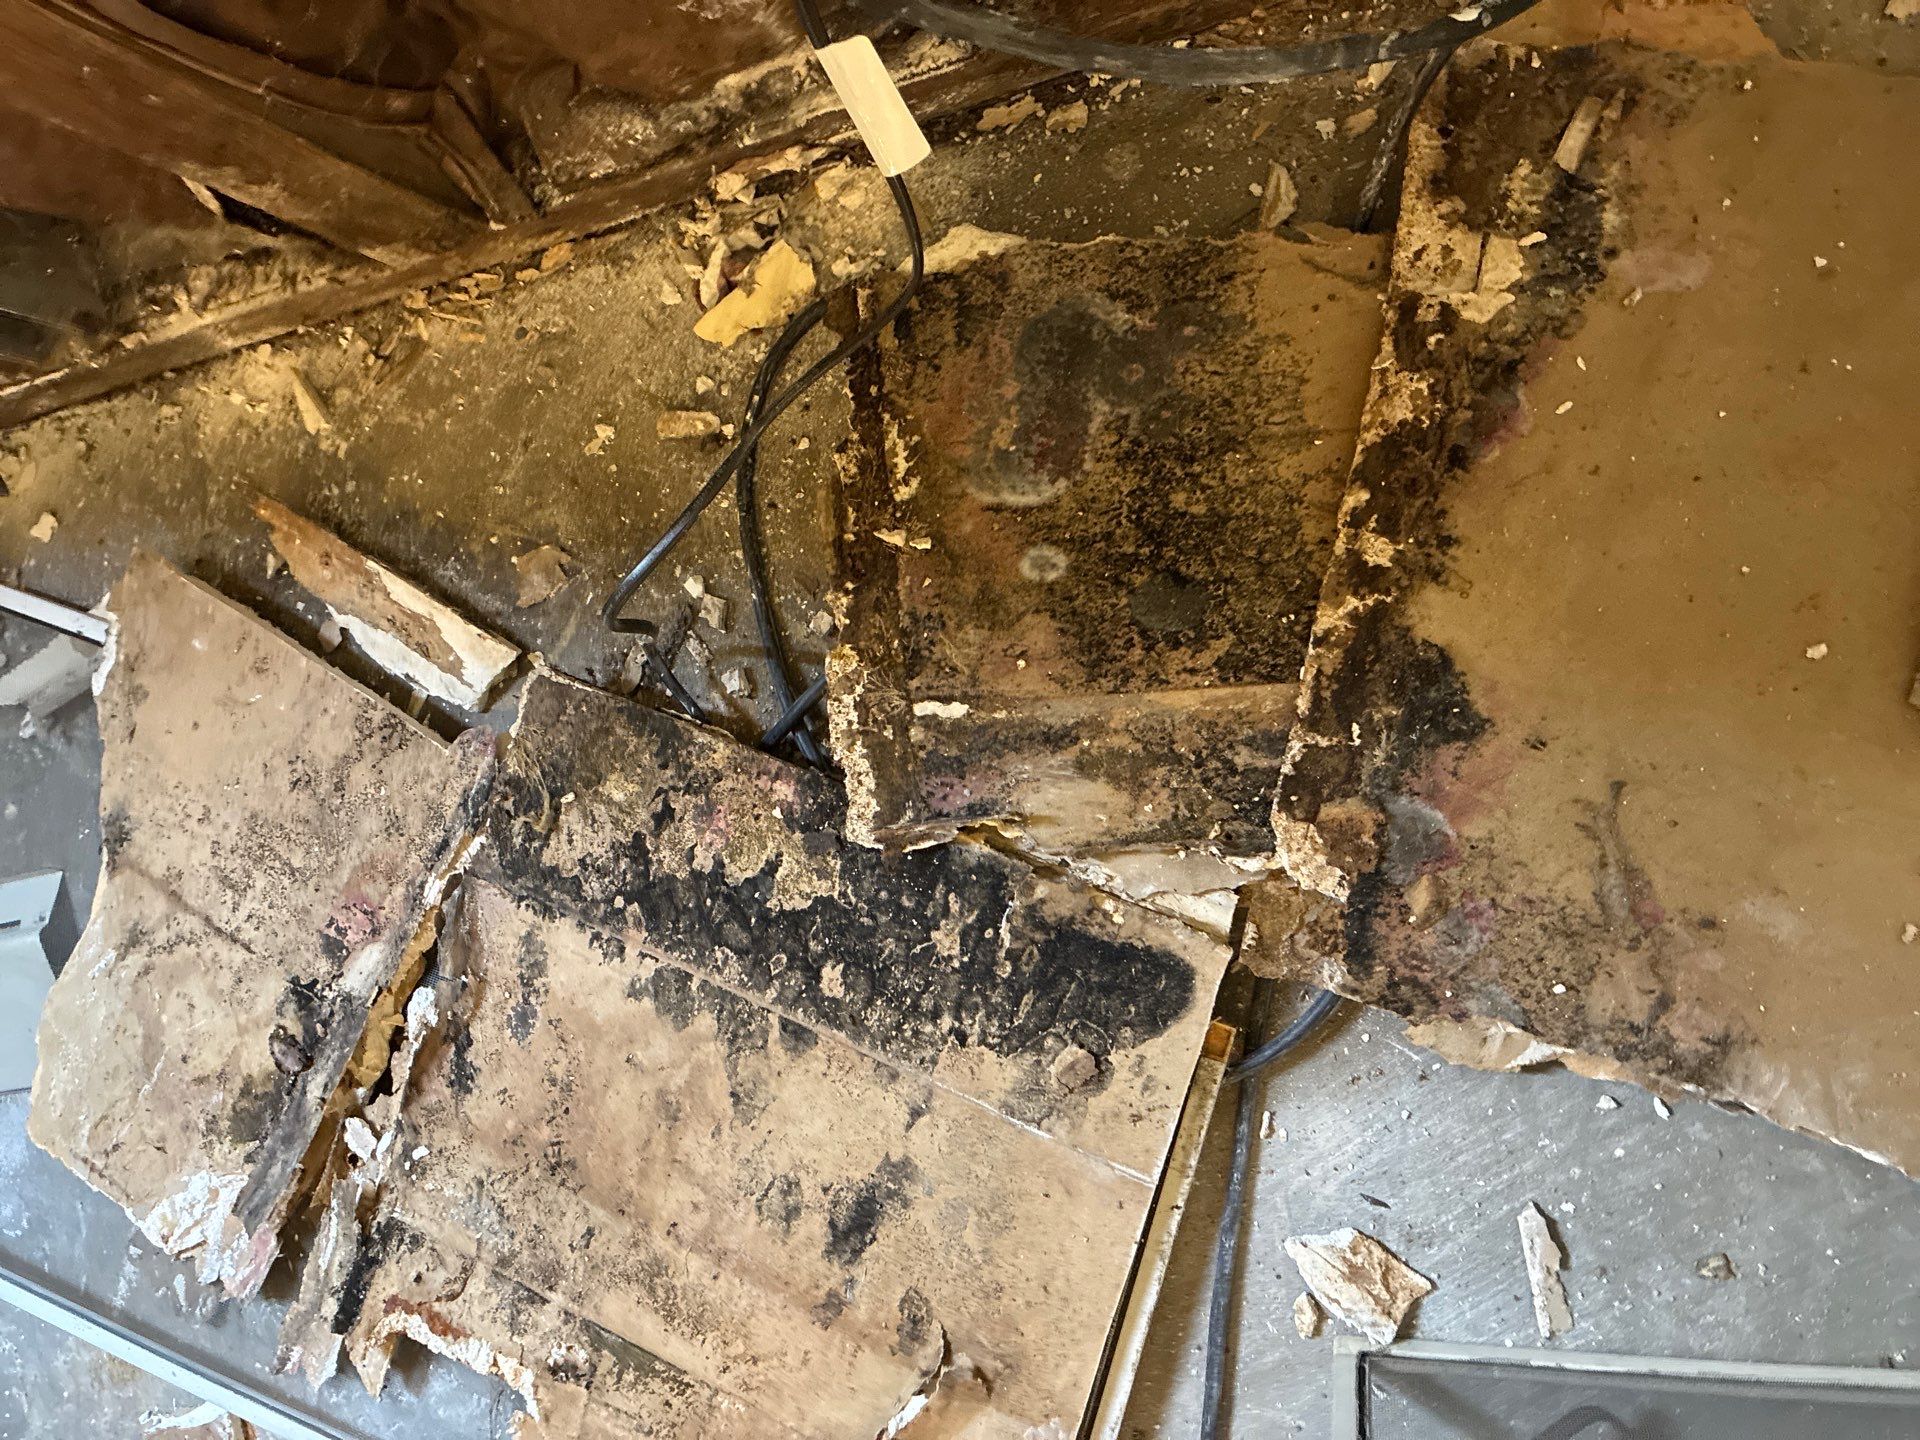
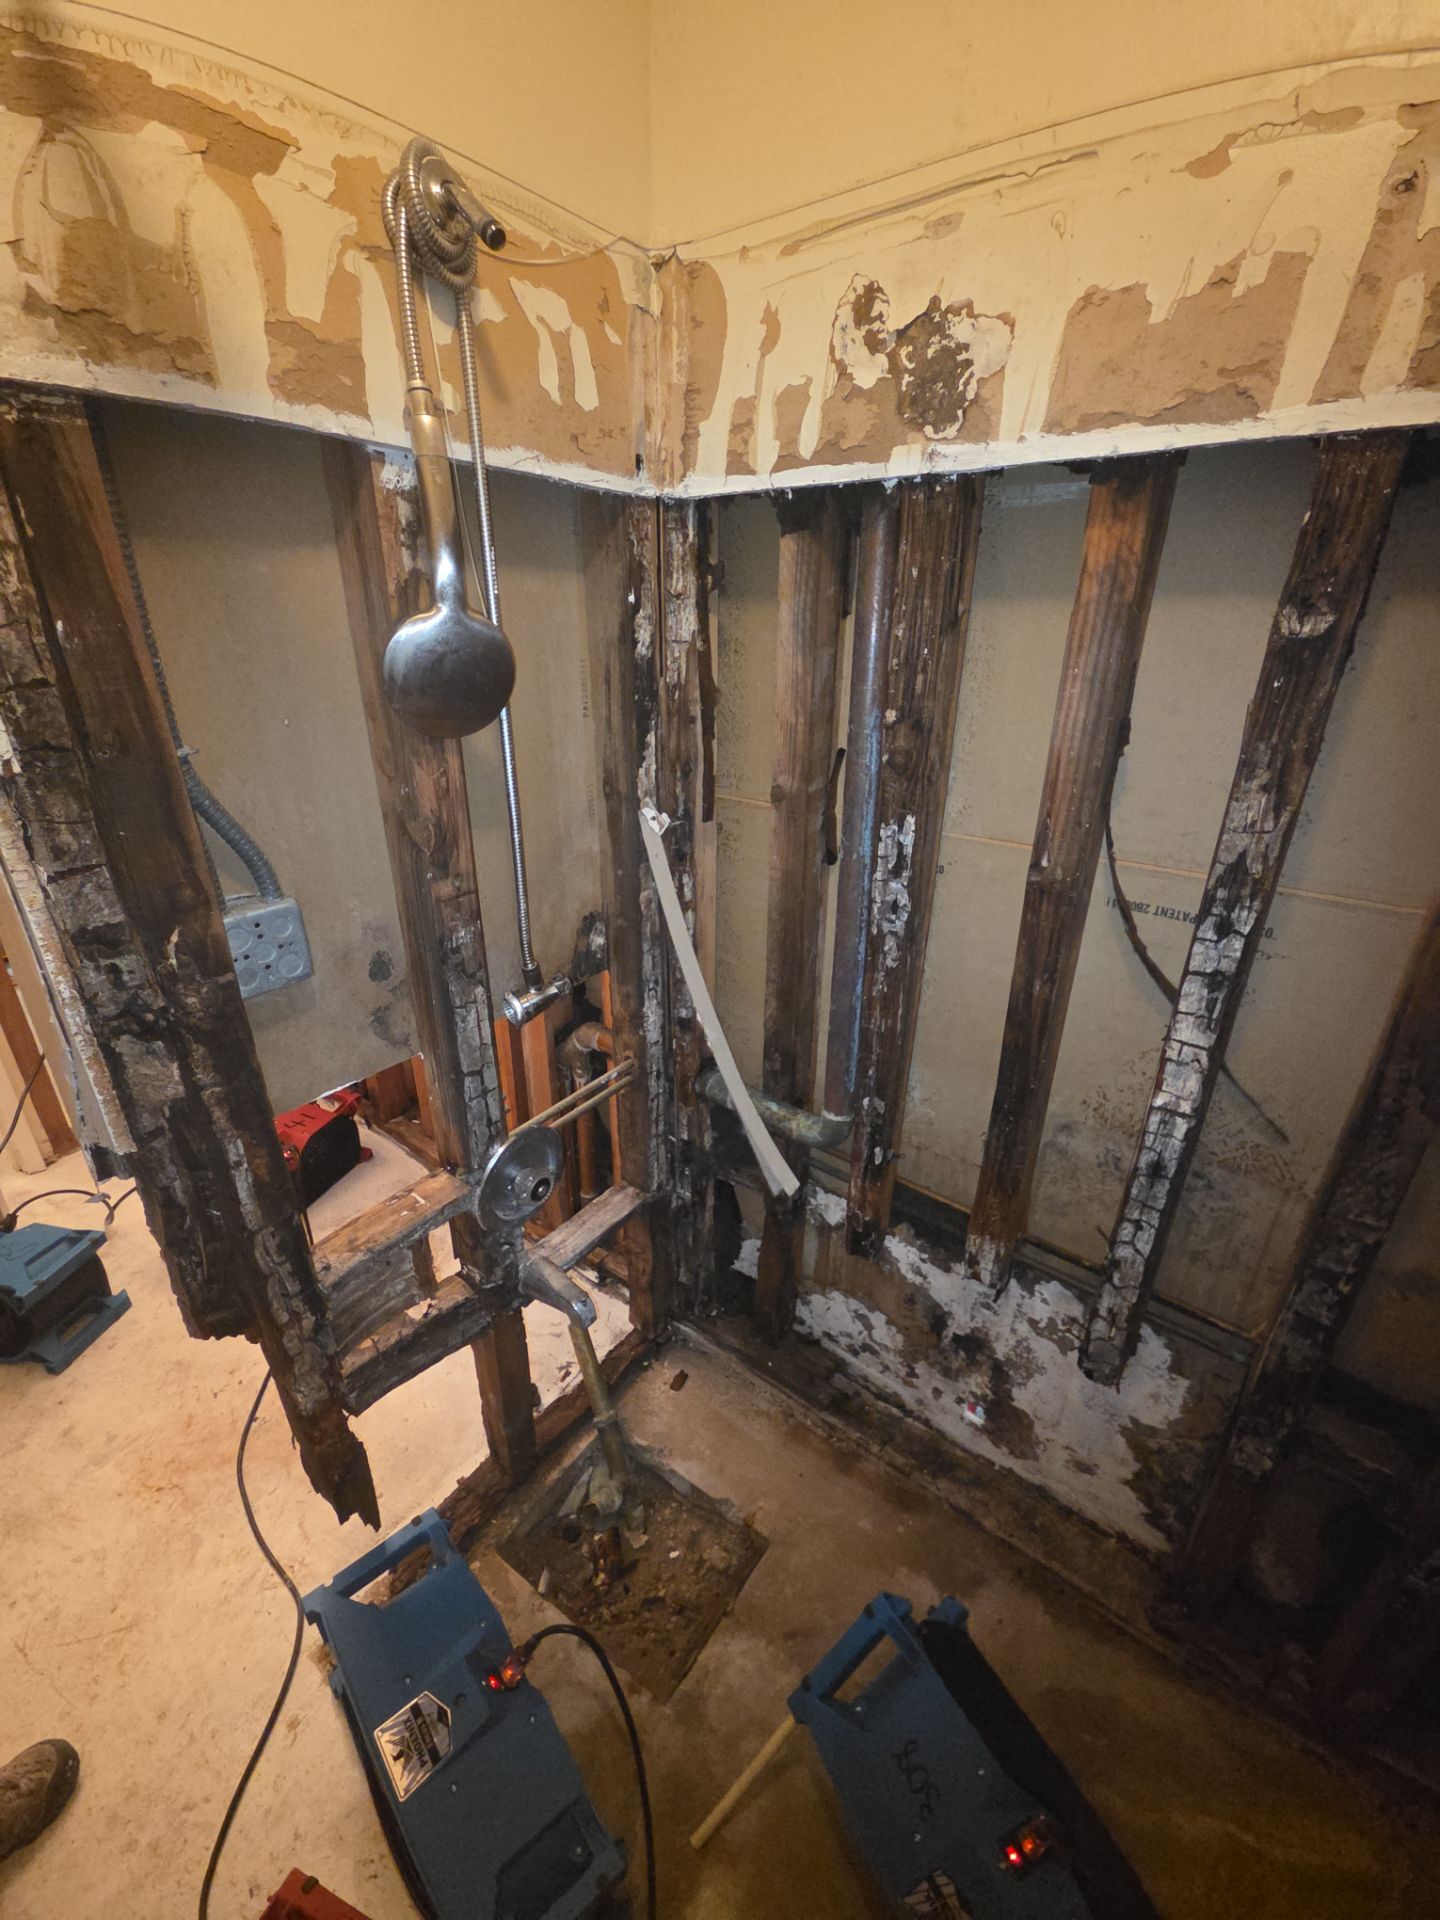
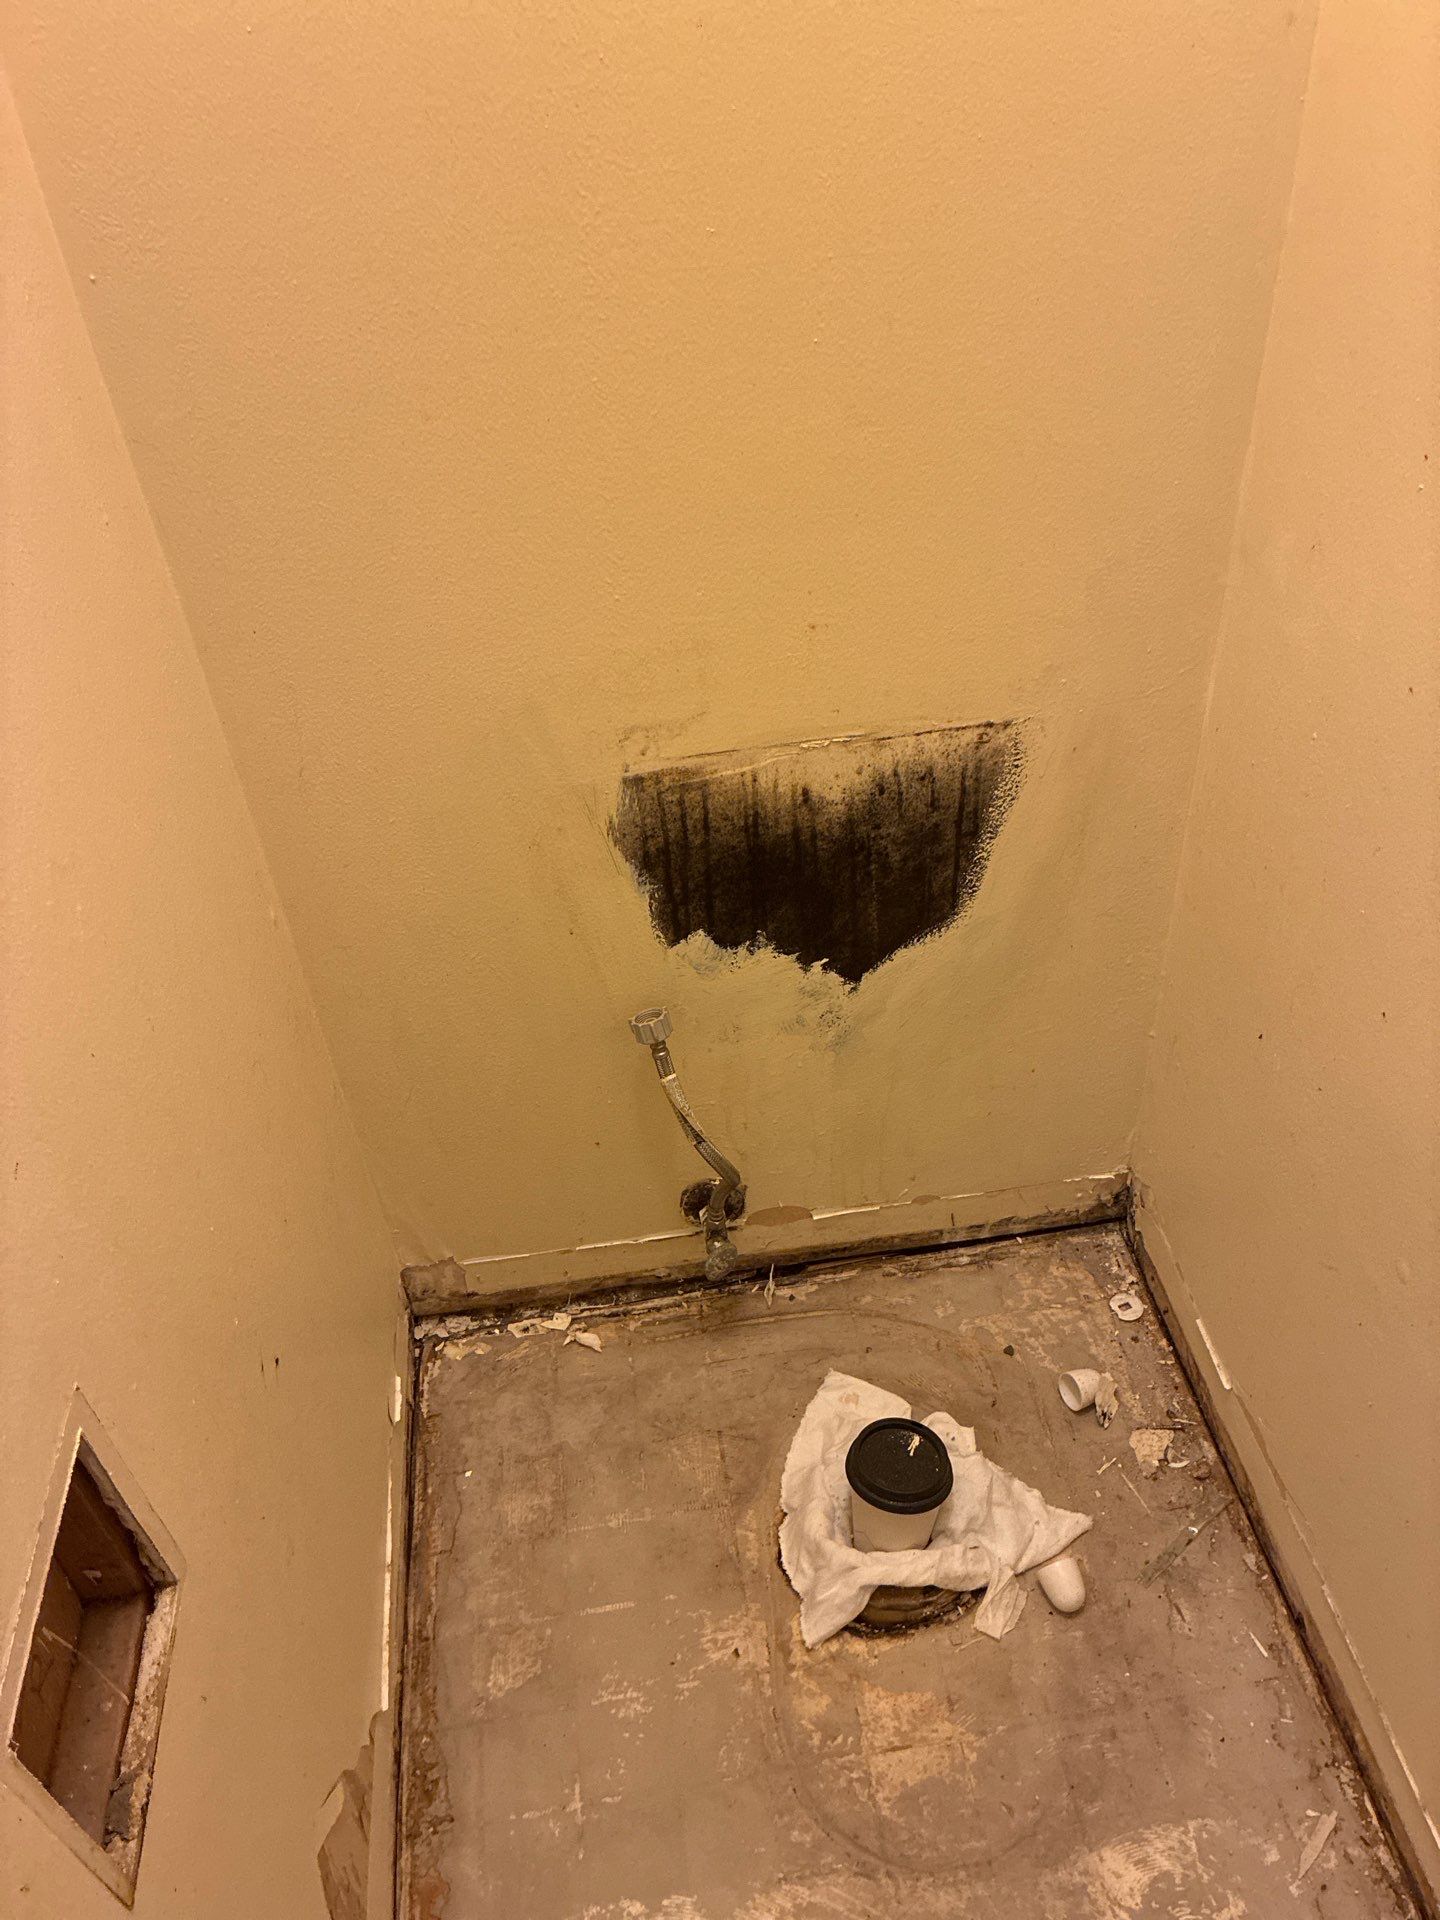
RemediatedThe water loss impacted the first-floor units, including occupied Units 101, 103, 106, and 107, as well as the laundry room and electrical room. The residents in the affected occupied units elected to remain in place. The resulting insurance claim proceeds created an opportunity to advance the asset's broader repositioning strategy by restoring the impacted areas to the new building standard while reducing the Owner's required out-of-pocket capital contribution.
Building age & existing conditions
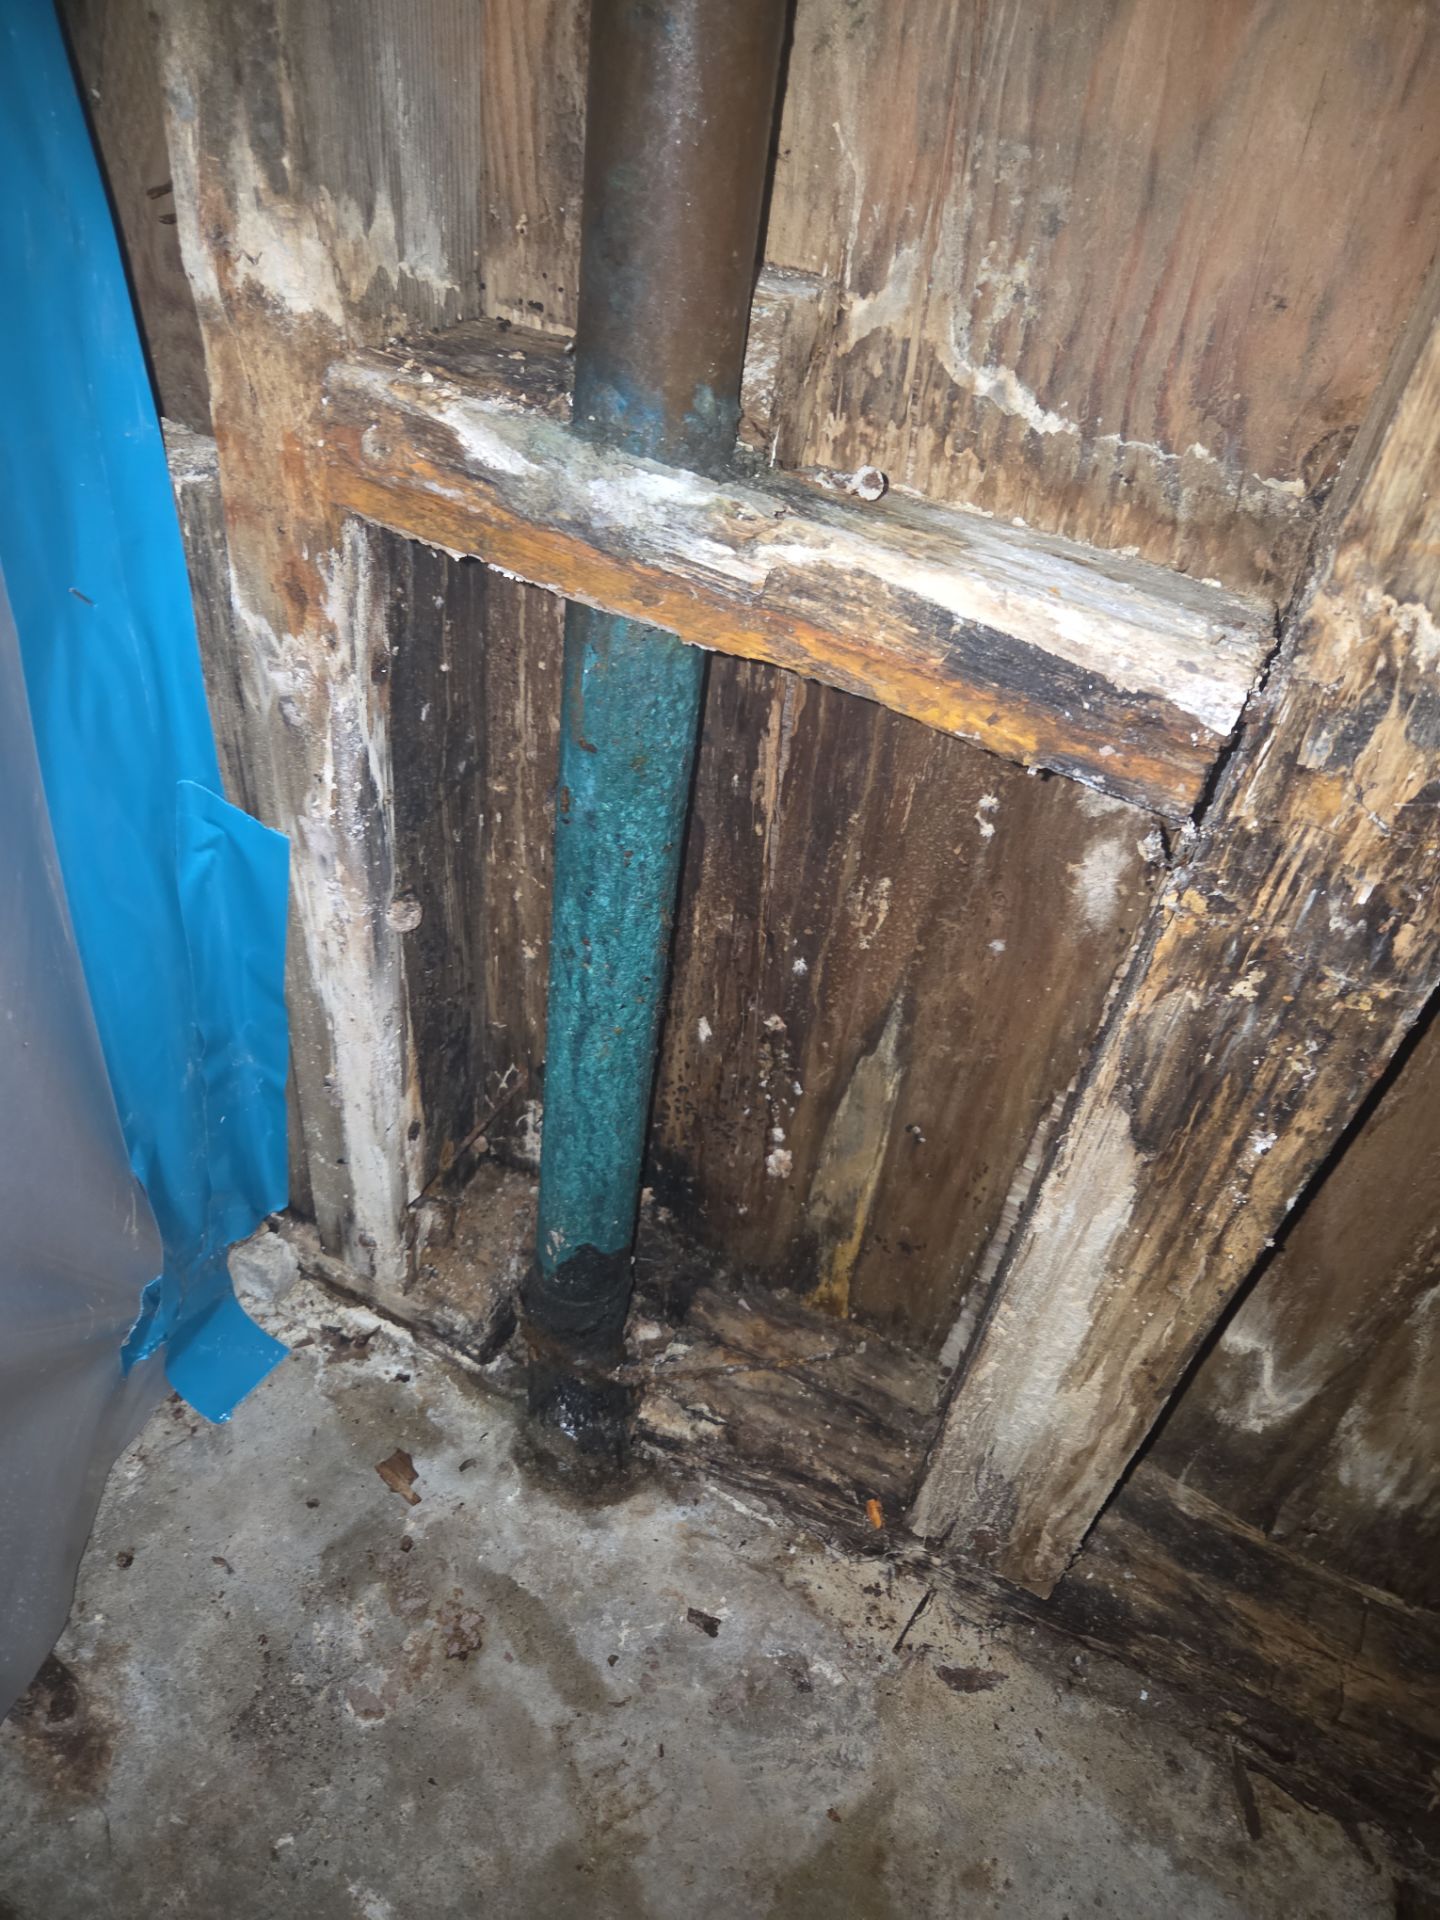
OngoingEra-typical plumbing, electrical, and envelope conditions, sequenced into the phase plan.
Abatement
CompleteHazardous materials identified, abated through licensed remediation, and cleared — documentation in the owner portal.
Unforeseen conditions
ItemizedDemolition behind the tub wall in Unit 104 exposed concealed rot and microbial growth — assessed, repaired, and documented.
See the Unit 104 findings →- White Heather — Phase 2 Change Order 1
- White Heather — condensation pipes
- 6113 — remediation and rebuild
The thesis
Rents Drive Value
Consistent with Ownership's long-term resident retention strategy, the property has historically positioned rents slightly below market, successfully retaining high-quality, long-standing residents while maintaining occupancy stability. However, this approach also constrained the building's income profile and overall asset value.
With continued investment into the property and delivery of renovated units to the new building standard, the strategy is to move rents toward market over time while remaining focused on resident retention. Rather than forcing increases on existing residents, the plan prioritizes capturing market rents through turnover and offering current residents the opportunity to transfer into newly renovated units where appropriate.
| Unit type | Avg in-place rent | Market rent | Renovated market |
|---|---|---|---|
| 1 bed / 1 bath | ~$1,430 (classic) | $1,500 | $1,750 |
| 2 bed / 2 bath | ~$1,940 | $2,150 | $2,295 |
| 2 bed / 1.5 bath | $1,785 | $1,900 | — |
June 11, 2026 rent roll, occupied units. Vacancy accounts for part of the gap (8 units); below-market in-place rents the remainder. At typical Seattle small-building cap rates, each $1,000/mo of added rent supports ≈$200,000 of value.
Proof to date
Renovated Units Are Achieving Target Rents
| Unit | Type | Size | New rent | Prior rent | Annual increase |
|---|---|---|---|---|---|
| 102 | 2/2 | 985 SF | $2,150 | $1,800 | $4,200 |
| 202 | 2/2 | 985 SF | $2,595 | $1,825 | $9,240 |
| 307 | 2/2 | 985 SF | $2,350 | $1,895 | $5,460 |
Unit 307 · 2/2
$2,350Leased in April 2026 at $2,350, exceeding the target market rent for the renovated unit. The resident transferred from an unrenovated unit where they were previously paying $1,750 per month, resulting in $7,200 in additional annual rental income. This successful transfer serves as a proof of concept for the broader repositioning strategy: retaining existing residents while converting them into newly renovated units at higher, market-supported rental rates.
Unit 202 · 2/2
$2,595Leased in June 2026 at $2,595, representing a meaningful increase over the prior unrenovated rent of $1,825, generating an additional $9,240 in annual rental income to the unit.
Unit 102 · 2/2
$2,150Leased in June 2026 at $2,150 per month, achieving the market rent for the unit. Prior to renovation, the unit was rented at $1,800 per month, resulting in $4,200 in additional annual rental income.
Unit-level detail
Availability and Delivery Timing
| Unit | Type | Size | Status | Market | Advertised | Note |
|---|---|---|---|---|---|---|
| 102 | 2/2 · renovated | 985 SF | Pre-leased | $2,295 | — | Leased before completion |
| 104 | 1/1 · renovated | 735 SF | Available | $1,750 | $1,795 | In lease-up |
| 105 | 1/1 · renovated | 735 SF | Available | $1,750 | $1,650 | Rent-ready |
| 204 | 1/1 · renovated | 735 SF | Available | $1,750 | $1,750 | In lease-up |
| 107 | 2/1.5 | 965 SF | In renovation | $1,900 | — | Phase 2 delivery |
| 201 | 1/1 | 735 SF | In renovation | $1,500 | — | Phase 2 delivery |
| 301 | 1/1 | 735 SF | In renovation | $1,500 | — | Phase 2 delivery |
| 304 | 1/1 | 735 SF | In renovation | $1,500 | — | Phase 2 · prior resident moved to 307 |
| 306 | 2/2 | 985 SF | On notice | $2,150 | — | Returns to inventory July 1 |
As of June 11, 2026 (rent roll). Advertised rent shown where a unit is actively listed; Phase 2 units price at delivery.
Tenure
Long-Term Residents
Below-market rents kept good people in place for years. Repositioning happens at turnover and renovation — not through increases on loyal residents.
| Unit | Resident since | Tenure | In-place rent | Market |
|---|---|---|---|---|
| 101 | 2011 | ~15 years | $1,373 | $1,500 |
| 303 | 2016 | ~10 years | $1,305 | $1,500 |
| 103 | 2018 | ~7 years | $1,345 | $1,500 |
| 106 | 2020 | ~6 years | $1,890 | $2,150 |
Several long-term residents affected by the water event chose to remain. Tenure per the June 11, 2026 rent roll.
Pricing methodology
The Half-Mile Comparable Set
Pricing recommendations are grounded in the actual market, unit condition, and the improvements made — not opinion. Renters compare White Heather to buildings minutes away, so targets are set against the half-mile radius around 15th Ave NE. The full comparable-set report (HelloData) is available as a live report and in the owner portal.
| Property | Distance | 1-bed | 2-bed | Note |
|---|---|---|---|---|
| White Heather (renovated) | — | $1,750 | $2,295 | Subject |
| Raleigh | 0.34 mi | $1,495 | $1,895 | Carpeted · in-unit W/D |
| 12535 Roosevelt | 0.34 mi | — | $1,995 | Renovated · in-unit W/D · 100% leased |
| Pinehurst West | 0.34 mi | $1,450 | $2,245 | Renovated · in-unit W/D · 100% leased |
Owned media
The Website & Google Campaign
Paid listing sites rent attention; the building's own website builds it. A Google campaign launches the pipeline, and the site keeps producing long after.
Owned, not rented
Stop paying a listing platform and its traffic stops. SEO converts marketing expense into a long-term digital asset that keeps producing.
Google campaign
A pay-per-click campaign (~$200–$250/mo) drives qualified search traffic straight to the building's own site; SEO typically begins showing results within about three weeks.
Search visibility
Searches for "White Heather Apartments" and phrases like "apartments Northgate / Pinehurst" should land on our page, our photographs, and our application link — not a listing aggregator's.
Better-qualified leads
Website prospects sought the property out intentionally; they arrive more educated and convert to tours and leases at higher rates.
Trailing 30 days
Lead Activity Today
| Source | Leads (trailing 30 days) | Placement |
|---|---|---|
| Zumper | 3 | Unpaid syndication |
| Apartment List | 2 | Unpaid syndication |
| Zillow | 1 | Base package ($99/mo) |
| Uloop | 1 | Unpaid syndication |
Source: internal lead tracking. Current volume reflects entry-level placement — the recommendations below are the lever for raising it.
Recommendations
The Channel Mix
We evaluate advertising sites on total impressions and how they convert — to guest cards, to showings, to signed leases — then direct more advertising dollars to the channels that perform. Select a card for pricing and the full analysis.
Zillow — Enhanced package
The largest consumer rental audience (Zillow, Trulia, HotPads). The Enhanced tier roughly doubles views, impressions, and prospects versus our current base listing — the fastest path to occupancy during lease-up.
Pricing & performance →Website, SEO & Google campaign
Paid platforms rent attention; the building's own site builds it. A pay-per-click campaign (~$200–$250/mo) launches the pipeline, and SEO typically shows results within about three weeks.
Economics & measurement →EDDM — neighborhood mailer
USPS every-door postcards across four mapped routes around the building — 2,423 addresses, 1,312 of them apartments, at $640 per route per drop. Renters frequently move within their own neighborhood.
Routes & costs →Apartments.com
Fewer but more qualified leads and the strongest property showcase — a conversion platform rather than a traffic engine, typically suited to communities of 100+ units. The Gold package includes a professional photo shoot.
Pricing & head-to-head →| Channel | Pricing | Coverage / projection | Role |
|---|---|---|---|
| Zillow Enhanced | $625/mo (6-mo) · $550/mo (12-mo) | ≈2× base exposure | Primary traffic |
| Zillow Base (current) | $99/mo | ~20 leads/mo projected avg | In place today |
| Google drip campaign | $200–$250/mo (≈$10/day PPC) | Scales with leasing velocity | Owned pipeline |
| EDDM mailer | $640/route per drop ($2,560 all four) | 2,423 addresses · 1,312 apartments | Neighborhood reach |
| Apartments.com Gold | $319/mo (12-mo, incl. photo shoot) | Lower volume, higher quality | Conversion / showcase |
Retention
Resident Transfer Program
Residents-first has defined White Heather for decades; the transfer program carries that approach into the renovation. Renovated units are offered to existing residents first — at a preferred in-house rate, before public advertising — keeping good tenants, upgrading the resident profile, and filling vacancies faster.
How it works
Vacant renovated units are offered at a below-market, in-house rate. The existing security deposit is returned and applied toward the new unit's deposit, case-by-case — the renovated unit's condition keeps exposure low.
Completed
304 → 307Unit 304's resident transferred into renovated 307 at $2,350; 304 then entered Phase 2 renovation.
In motion
106 → 107 · 207Unit 106's resident has asked to move into 107 once renovated, at the market rate; unit 207 has been offered a transfer and is considering it.
Honored in place
Long-term, water-event-affected residents — including 101, 103, and 303 — have chosen to stay. Where a market increase is not feasible, their tenancy is respected and repositioning waits for natural turnover.
First impressions
Welcome Packet & Move-In Gifts
Packet contents
Move-in checklist · building contacts and emergency numbers · utility setup · neighborhood guide · maintenance request instructions (resident portal) · house rules.
Operations
The Move-In Process
Application & screening
Through the resident portal — consistent criteria, documented decisions.
Lease signing & deposit
Digital signing; deposits and terms per the Leasing page.
Unit ready & walkthrough
Delivered units only; photo-documented condition report.
Move-in day
Keys, packet, and gift, with a check-in message in week one.
Quick reference
Property Documents
One place to see progress, review materials, and track decisions. Each folder opens to its documents — mirrored from the official records.
Statements, bids & reports
Inside the Portal
Log in
Each family member receives individual credentials — provisioned by AGM and resettable at any time.
Monthly statements
Income, expenses, and distributions, delivered every month without the need for a request.
Document repository
Approved bids, insurance documents, abatement clearances, and reports — also gathered in Property Documents on this page.
Jerry's market comparable report
The complete digital comparable study supporting the figures on the Leasing page.